10.11. Performance Analysis
There are many potential causes for for performance issues. In this section we will guide you through some options. The first part will cover basic steps and introduce some helpful tools. The second part will cover more in-depth explanations and corner cases.
10.11.1. System Load
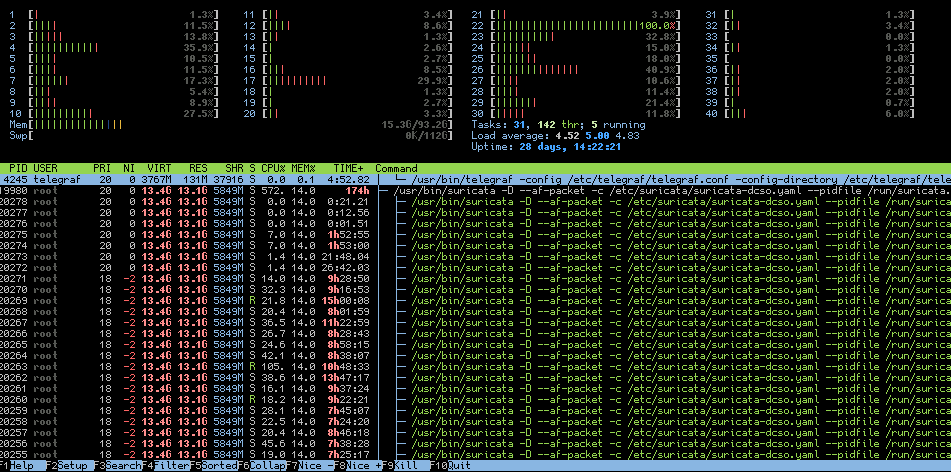
The first step should be to check the system load. Run a top tool like htop to get an overview of the system load and if there is a bottleneck with the traffic distribution. For example if you can see that only a small number of cpu cores hit 100% all the time and others don't, it could be related to a bad traffic distribution or elephant flows like in the screenshot where one core peaks due to one big elephant flow.

If all cores are at peak load the system might be too slow for the traffic load or it might be misconfigured. Also keep an eye on memory usage, if the actual memory usage is too high and the system needs to swap it will result in very poor performance.
The load will give you a first indication where to start with the debugging at specific parts we describe in more detail in the second part.
10.11.2. Logfiles
The next step would be to check all the log files with a focus on stats.log and suricata.log if any obvious issues are seen. The most obvious indicator is the capture.kernel_drops value that ideally would not even show up but should be below 1% of the capture.kernel_packets value as high drop rates could lead to a reduced amount of events and alerts.
If memcap is seen in the stats the memcap values in the configuration could be increased. This can result to higher memory usage and should be taken into account when the settings are changed.
Don't forget to check any system logs as well, even a dmesg run can show potential issues.
10.11.3. Suricata Load
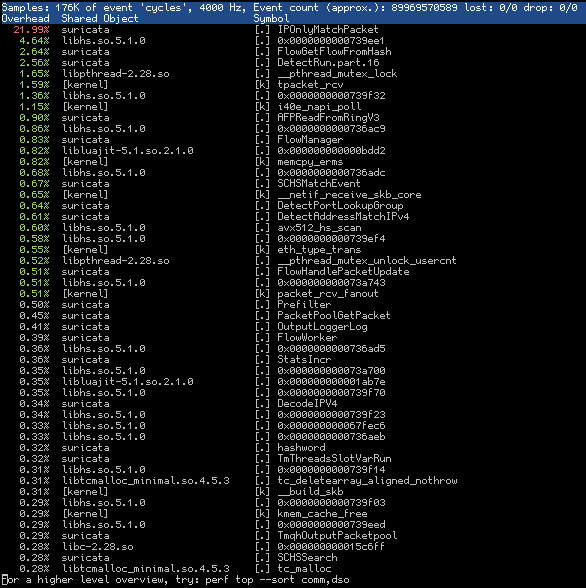
Besides the system load, another indicator for potential performance issues is the load of Suricata itself. A helpful tool for that is perf which helps to spot performance issues. Make sure you have it installed and also the debug symbols installed for Suricata or the output won't be very helpful. This output is also helpful when you report performance issues as the Suricata Development team can narrow down possible issues with that.
sudo perf top -p $(pidof suricata)
If you see specific function calls at the top in red it's a hint that those are the bottlenecks. For example if you see IPOnlyMatchPacket it can be either a result of high drop rates or incomplete flows which result in decreased performance. To look into the performance issues on a specific thread you can pass -t TID to perf top. In other cases you can see functions that give you a hint that a specific protocol parser is used a lot and can either try to debug a performance bug or try to filter related traffic.

In general try to play around with the different configuration options that Suricata does provide with a focus on the options described in High Performance Configuration.
10.11.4. Traffic
In most cases where the hardware is fast enough to handle the traffic but the drop rate is still high it's related to specific traffic issues.
10.11.4.1. Basics
Some of the basic checks are:
Check if the traffic is bidirectional, if it's mostly unidirectional you're missing relevant parts of the flow (see tshark example at the bottom). Another indicator could be a big discrepancy between SYN and SYN-ACK as well as RST counter in the Suricata stats.
Check for encapsulated traffic, while GRE, MPLS etc. are supported they could also lead to performance issues. Especially if there are several layers of encapsulation.
Use tools like iftop to spot elephant flows. Flows that have a rate of over 1Gbit/s for a long time can result in one cpu core peak at 100% all the time and increasing the droprate while it might not make sense to dig deep into this traffic.
Another approach to narrow down issues is the usage of bpf filter. For example filter all HTTPS traffic with not port 443 to exclude traffic that might be problematic or just look into one specific port port 25 if you expect some issues with a specific protocol. See Ignoring Traffic for more details.
If VLAN is used it might help to disable vlan.use-for-tracking in scenarios where only one direction of the flow has the VLAN tag.
10.11.4.2. Advanced
There are several advanced steps and corner cases when it comes to a deep dive into the traffic.
If VLAN QinQ (IEEE 802.1ad) is used be very cautious if you use cluster_qm in combination with Intel drivers and AF_PACKET runmode. While the RFC expects ethertype 0x8100 and 0x88A8 in this case (see https://en.wikipedia.org/wiki/IEEE_802.1ad) most implementations only add 0x8100 on each layer. If the first seen layer has the same VLAN tag but the inner one has different VLAN tags it will still end up in the same queue in cluster_qm mode. This was observed with the i40e driver up to 2.8.20 and the firmare version up to 7.00, feel free to report if newer versions have fixed this (see https://suricata.io/community/).
If you want to use tshark to get an overview of the traffic direction use this command:
sudo tshark -i $INTERFACE -q -z conv,ip -a duration:10
The output will show you all flows within 10s and if you see 0 for one direction you have unidirectional traffic, thus you don't see the ACK packets for example. Since Suricata is trying to work on flows this will have a rather big impact on the visibility. Focus on fixing the unidirectional traffic. If it's not possible at all you can enable async-oneside in the stream configuration setting.
Check for other unusual or complex protocols that aren't supported very well. You can try to filter those to see if it has any impact on the performance. In this example we filter Cisco Fabric Path (ethertype 0x8903) with the bpf filter not ether proto 0x8903 as it's assumed to be a performance issue (see https://redmine.openinfosecfoundation.org/issues/3637)
10.11.4.3. Elephant Flows
The so called Elephant Flows or traffic spikes are quite difficult to deal with. In most cases those are big file transfers or backup traffic and it's not feasible to decode the whole traffic. From a network security monitoring perspective it's often enough to log the metadata of that flow and do a packet inspection at the beginning but not the whole flow.
If you can spot specific flows as described above then try to filter those. The easiest solution would be a bpf filter but that would still result in a performance impact. Ideally you can filter such traffic even sooner on driver or NIC level (see eBPF/XDP) or even before it reaches the system where Suricata is running. Some commercial packet broker support such filtering where it's called Flow Shunting or Flow Slicing.
10.11.5. Rules
The Ruleset plays an important role in the detection but also in the performance capability of Suricata. Thus it's recommended to look into the impact of enabled rules as well.
If you run into performance issues and struggle to narrow it down start with running Suricata without any rules enabled and use the tools again that have been explained at the first part. Keep in mind that even without signatures enabled Suricata still does most of the decoding and traffic analysis, so a fair amount of load should still be seen. If the load is still very high and drops are seen and the hardware should be capable to deal with such traffic loads you should deep dive if there is any specific traffic issue (see above) or report the performance issue so it can be investigated (see https://suricata.io/community/).
Suricata also provides several specific traffic related signatures in the rules folder that could be enabled for testing to spot specific traffic issues. Those are found the rules and you should start with decoder-events.rules, stream-events.rules and app-layer-events.rules.
It can also be helpful to use Rule Profiling and/or Packet Profiling to find problematic rules or traffic pattern. This is achieved by compiling Suricata with --enable-profiling but keep in mind that this has an impact on performance and should only be used for troubleshooting.